Insights
Insights consists of a palette of interactive visualization modules providing a deep look into your data and quick graphics-based filtering. These modules can be organized into sections shown as horizontal panels designed for a specific purpose and based on specific searches or categories of documents. The modules in each section can be chosen and configured by you to show the most useful feature analytics. Any module can be dragged and dropped to any position in any section and can be resized as you require. The order of the sections can be changed at any time. All this flexibility allows you to construct virtually any layout.
The data in each chart may be selected and added to a search.
Choose the meter icon to access the Insights view.

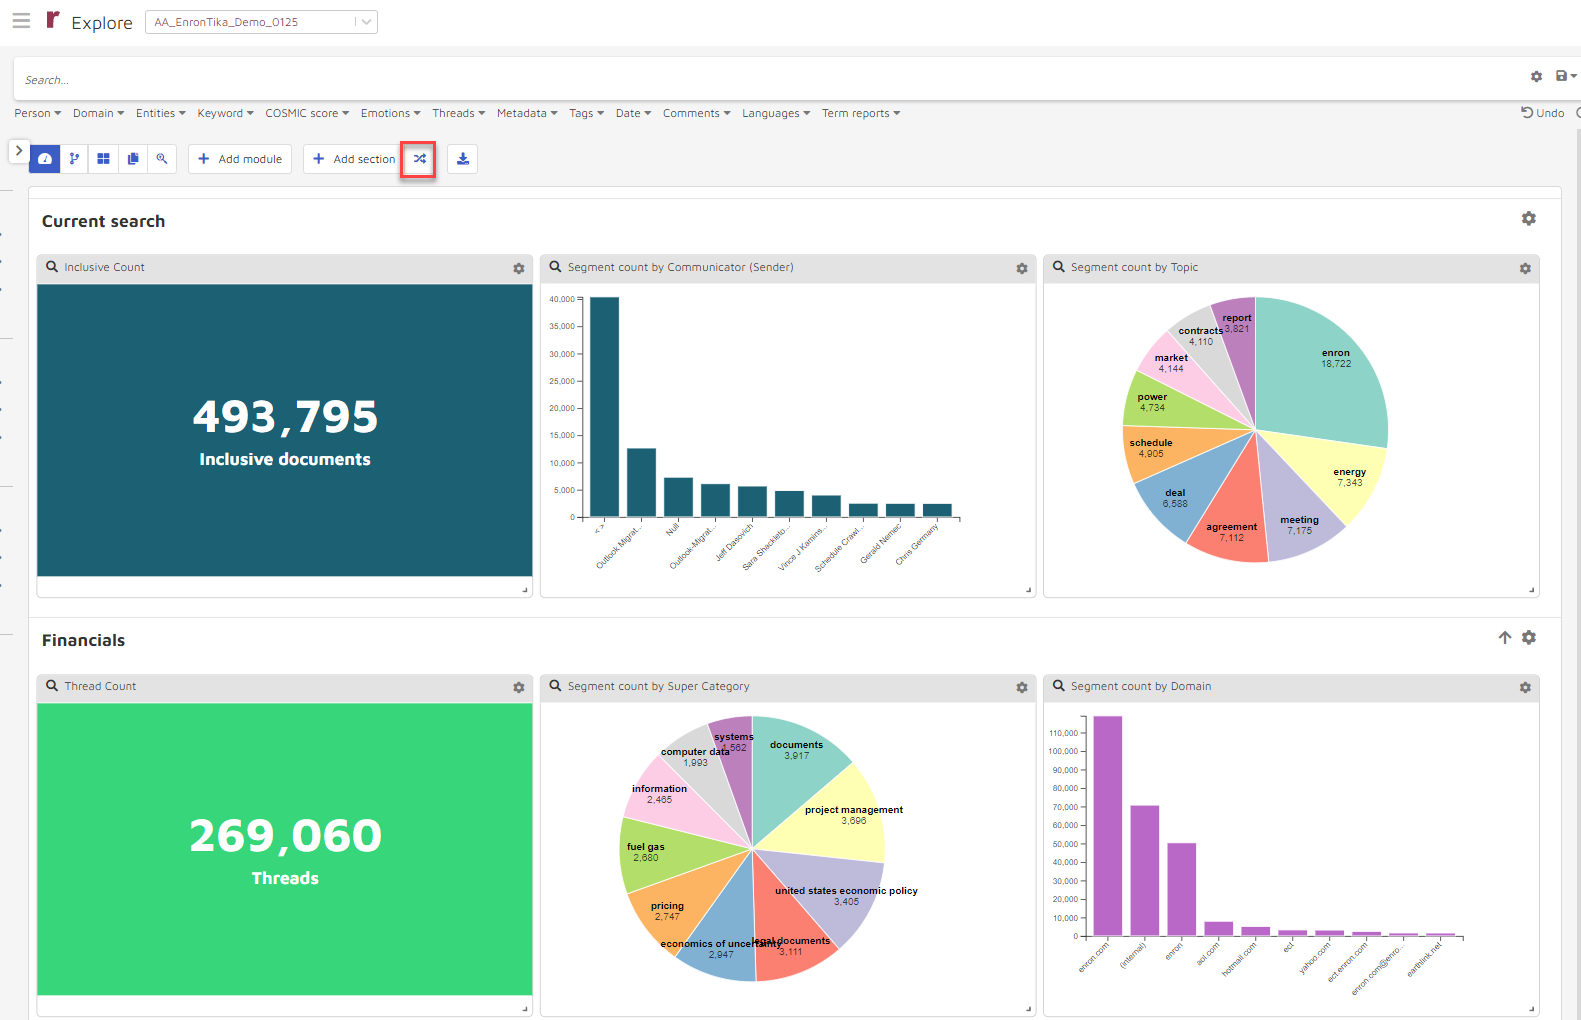
The following options are available:
+ Add Module: choose to add a module. This is illustrated below.
+ Add Section: choose to add a section. This is illustrated below.
Reorder Sections Icons: At the top of the page
 and to the right of the sections
  . Choose either of these to change the order of the section rows. Shown immediately below.
Export Insights as PDF Icon: Choose this icon
 to download all sections as a .pdf.
Reordering Sections
Choose the crossing arrow button highlighted below...
Grab the hamburger icon to move the Default Section one down...
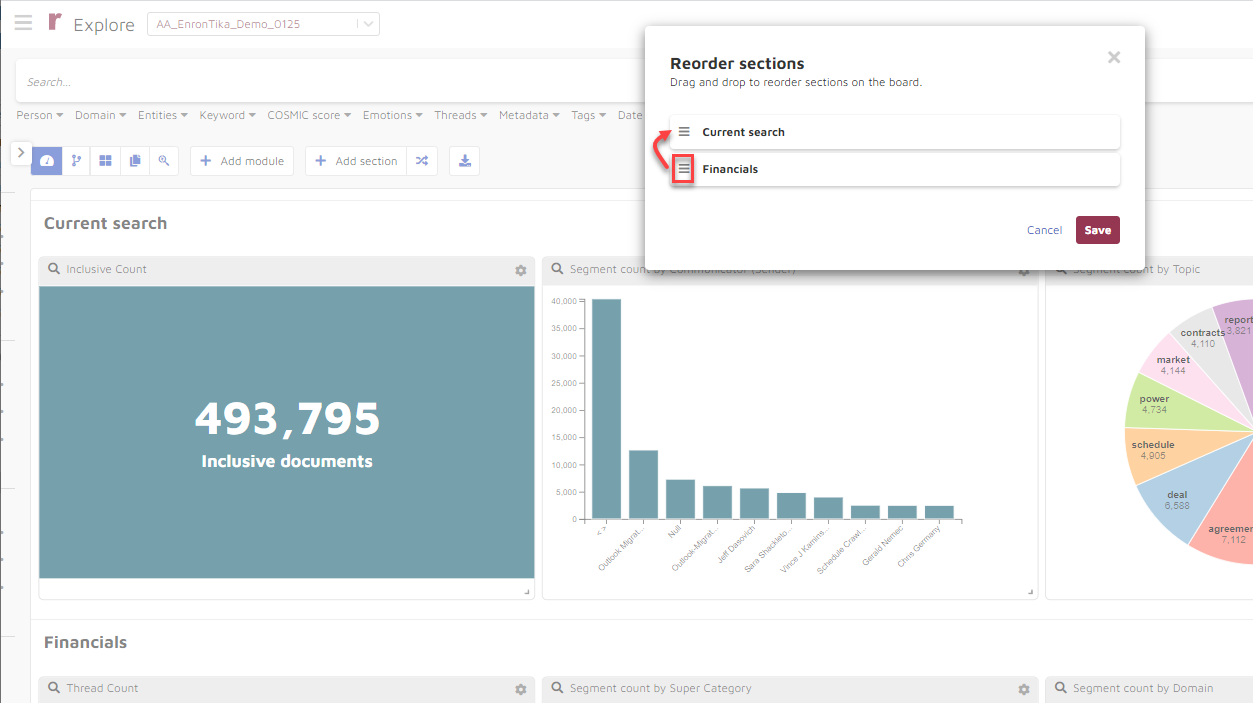
And the first and second sections have reversed position.
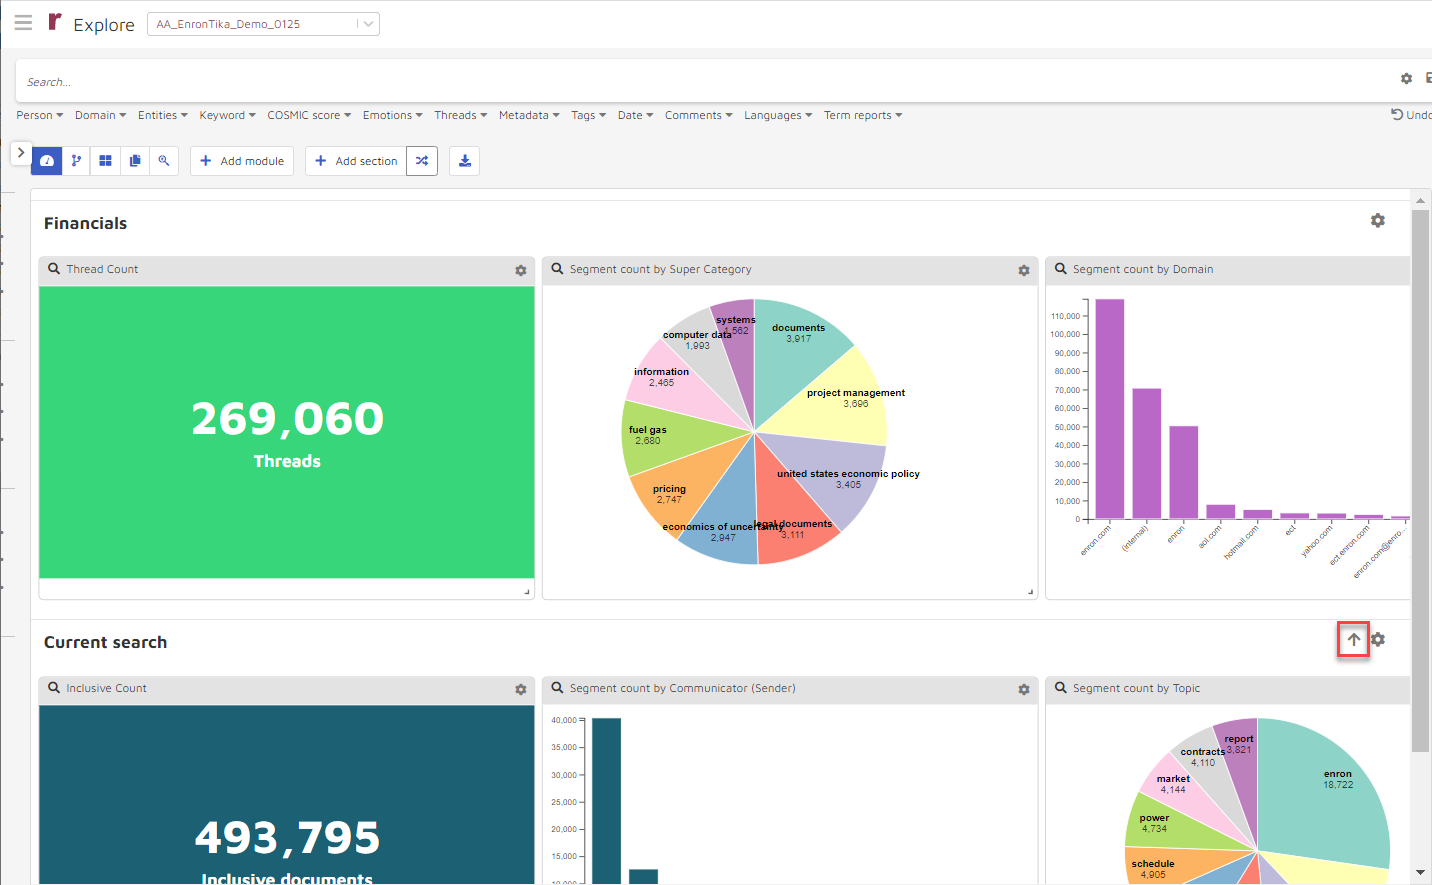
Alternately, you may use the vertical arrow to the right (highlighted above) to obtain the same results.
Building a new section
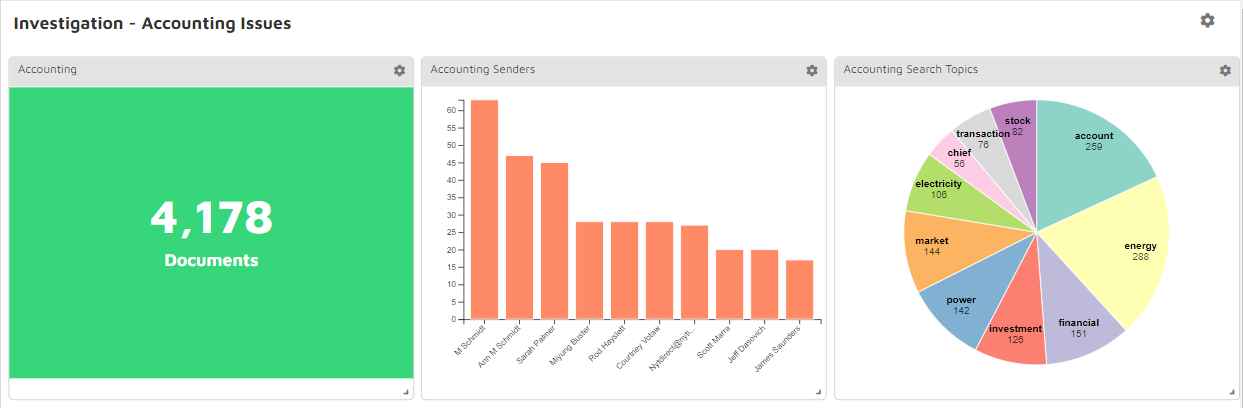
How do you build a new section on your Insights page? Let’s say you need a section entitled “Investigation - Accounting Issues”. First you search and filter according to whatever criteria are likely to return the relevant documents. Then save the search under a unique search title and choose “Make available for Insights modules”. See Section 3 - Searching and filtering documents > Save search results for more details.
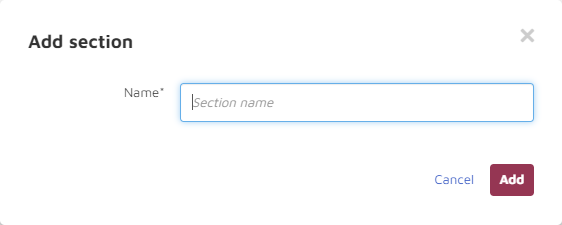
You then choose the “+ Add section” button...
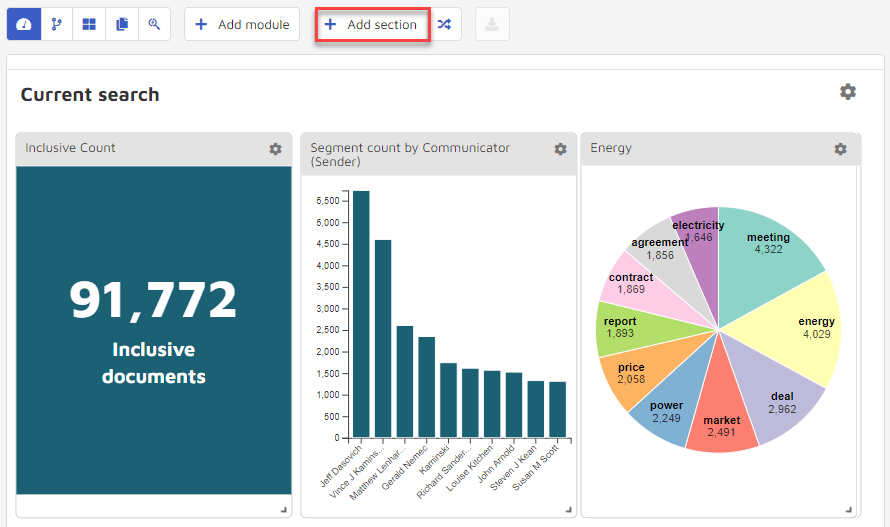
And the Add section window appears.
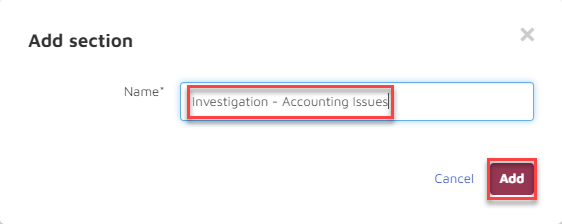
Fill in the name of the new section e.g. “Investigation-Accounting Issues” and choose Add:
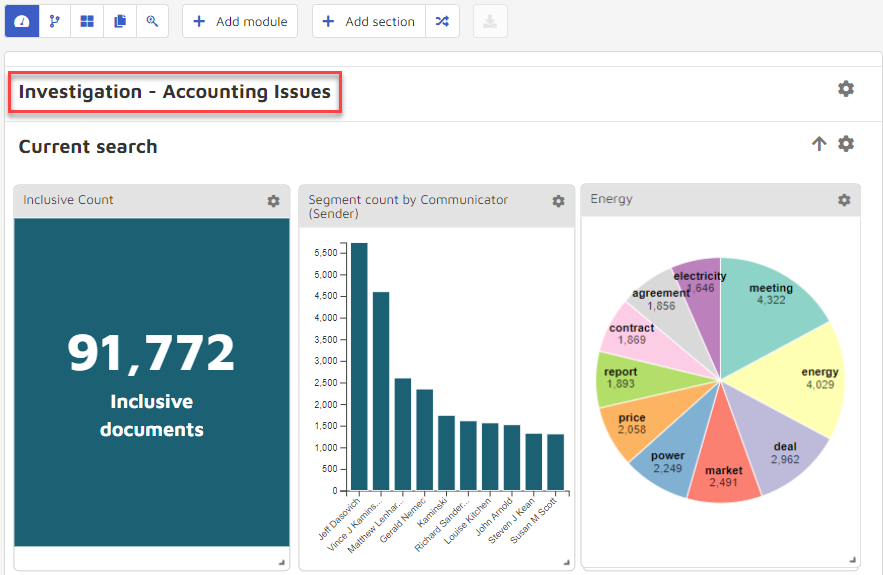
The new section appears in a new row for the yet-to-come modules:
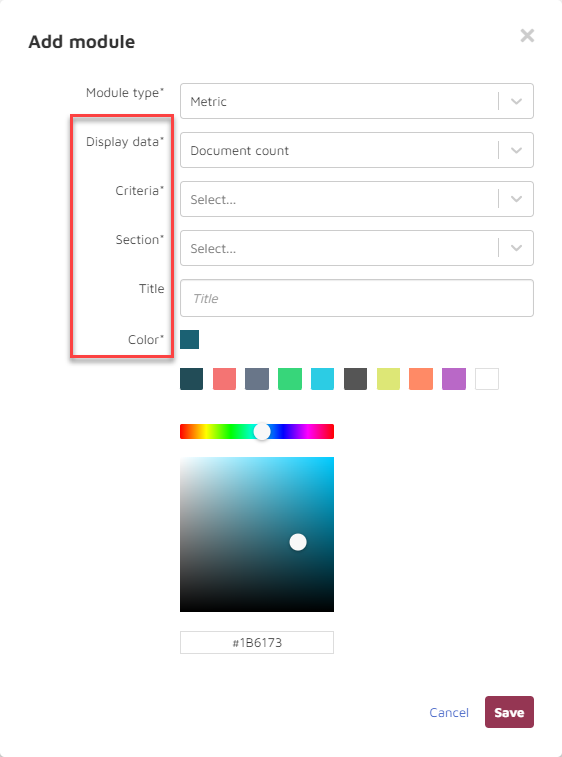
Choose + Add module and the following appears:
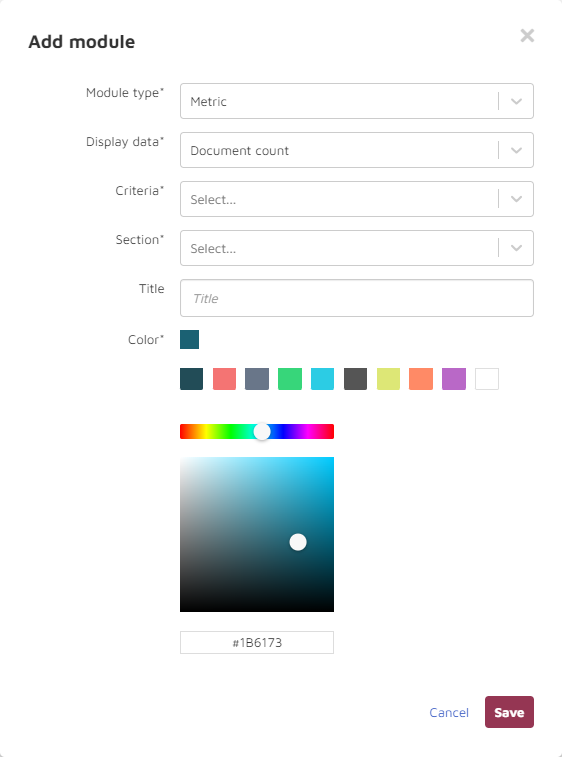
The Add module window provides the following choices: Module type, Display data, Criteria, Section and Color.
Choose the Module type dropdown:
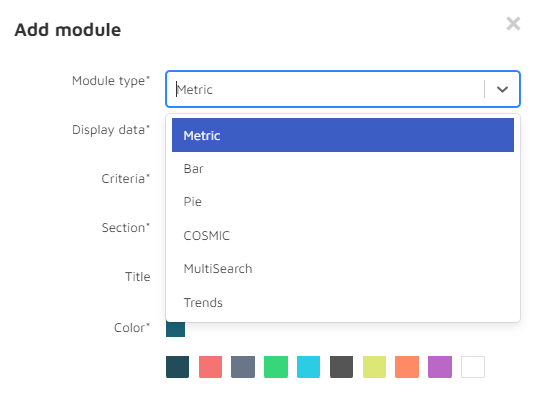
Module type choices:
Metric: This is often used at the beginning of a section (e.g., “Privileged Document Detection”) to show the volume and kind of “Display data” (see Metric section immediately below).
Bar: A bar graph (e.g., “Segment Count by Law Firm”) with items across the horizontal and volumes along the vertical.
Pie: A pie chart (e.g., “Segment Count by Law”) showing item names and counts in pie slices.
COSMIC: A COSMIC summary report in two sections showing tagging status of tagged documents and system evaluation of untagged documents.
MultiSearch: A way to view and compare several selected tagging results by model and choice.
Metric
If you choose the Metric Module type, you are presented with the following additional choices: Display data, Criteria, Section and Color.
Choose Display data dropdown and these choices appear:
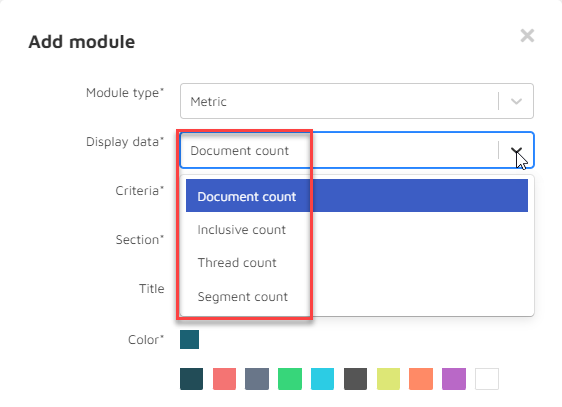
Display data sets your answer to the question What unit are you using to count the documents?
Document count: by individual document, such as an email.
Inclusive count: by the subset of emails and attachments that presents all the content of the family set at least once.
Thread count: by the number of distinct conversation threads.
Segment count: by each email message (and attachment) of every email.
Choose the Criteria dropdown and some version of these choices appear:
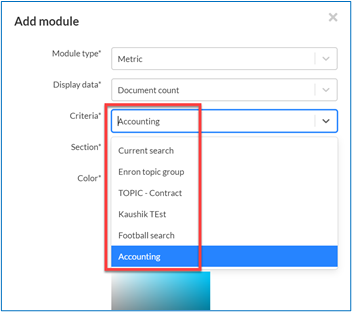
Criteria: What criteria are you using to select the data to be used?
Current Search: use the current search.
[Saved search by name]: Saved searches (for which you have checked the box “Make available for Insights”; see 3. Searching and Filtering Documents, M. Save Search results) will each appear by name in this dropdown list. In this example the Current Search is chosen.
Section: Choose the appropriate section.
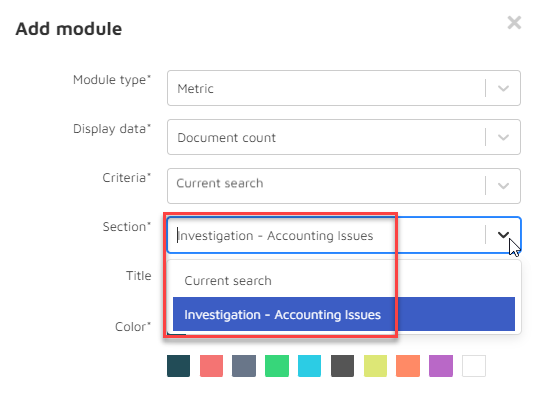
Title: Enter a title for the module.
Color: Choose a graphic color by one of several methods. (In this example we have checked a preset choice.)
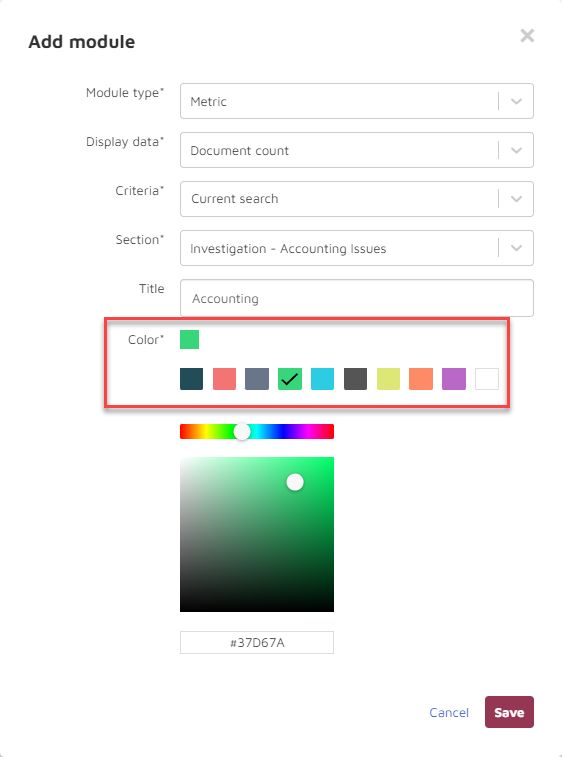
Choose Save and this resulting new module appears in the “Investigation-Accounts Issues” section:
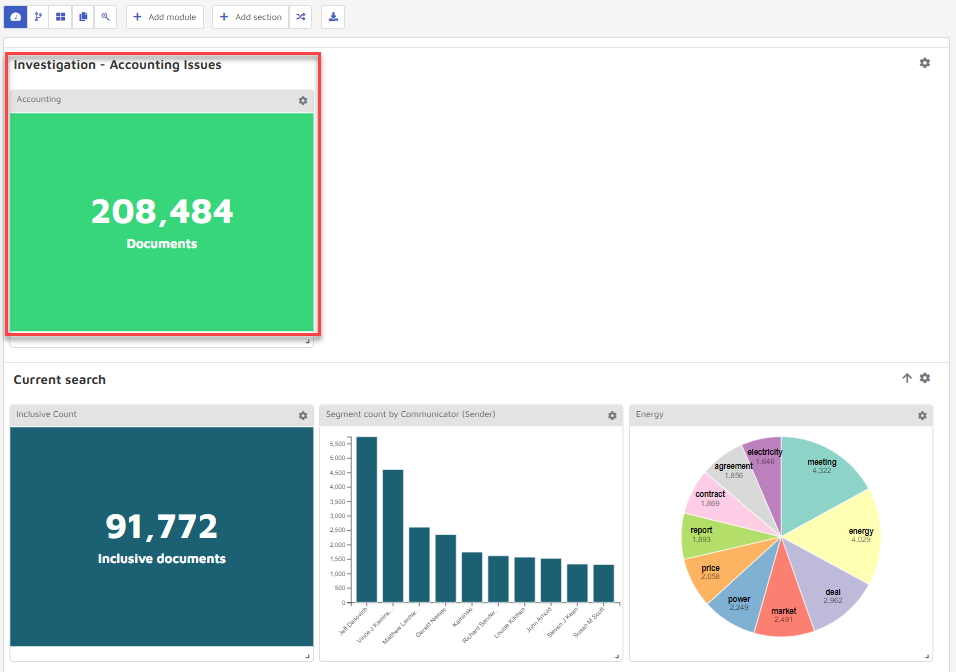
You may build out this section by adding additional modules.
Bar
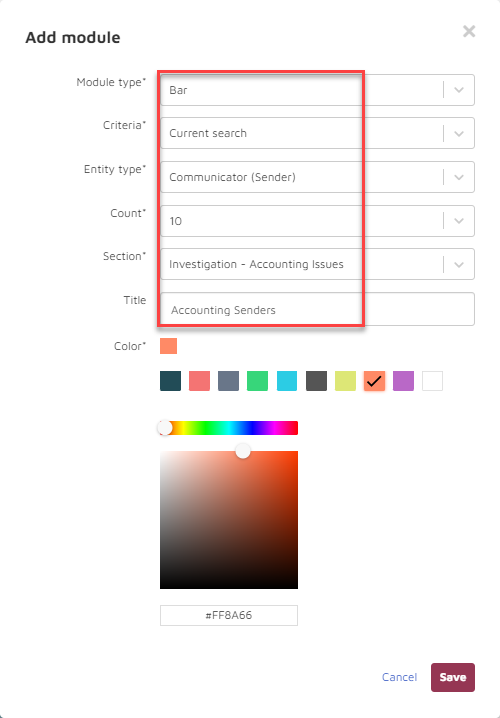
For example, choose + Add Module and under Entity type, choose Bar and the following appears:
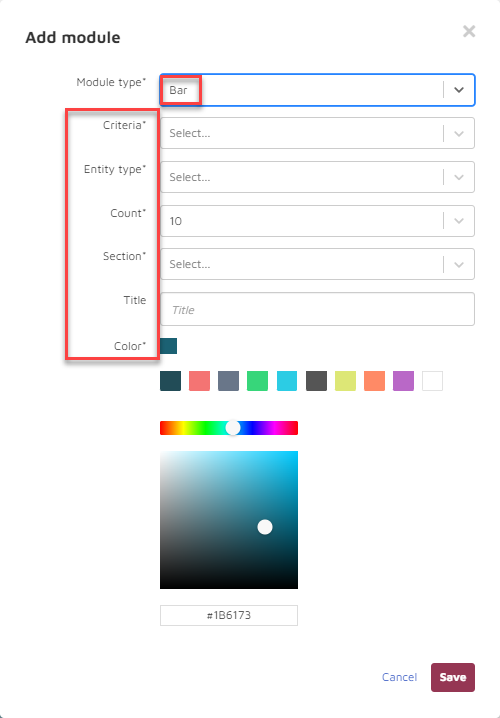
You need to make decisions regarding: Criteria, Entity Type, Count, Section, Title and Color.
Criteria: What criteria are you using to select the data to be used?
Current Search: use the current search.
[Saved search by name]: Saved searches (for which you have checked the box “Make available for dashboard”; see 3. Searching and Filtering Documents, L. Save Search results) will separately appear by name in this dropdown list. In this example the Current Search is chosen again.
Entity Type: For what entity type are you providing statistics? A dropdown list will display both standard and custom entity types (such as Communicator (Sender), Group, Law Firm, etc.).
Count: Number of items from the chosen category (such as specific Communicators) shown in chart (10,25,50).
Section: By choosing Investigation-Accounting Issues you will deploy this module into the row designated by that section header.
Title: Enter a title for the module.
Color: As before, you will choose the color of the chart.
Here is an example of the Add Module responses:
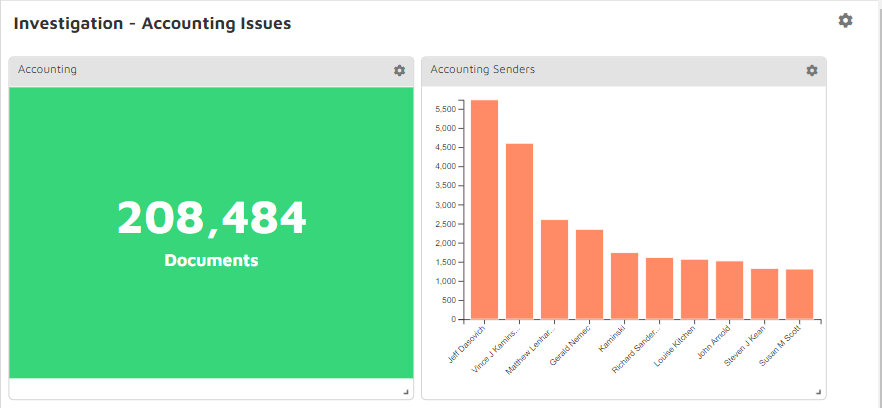
When you choose Save, your Investigation-Accounting Issues section will now look like this:
Pie
For another module, if you choose Pie as the module type, the Add module window now appears as:
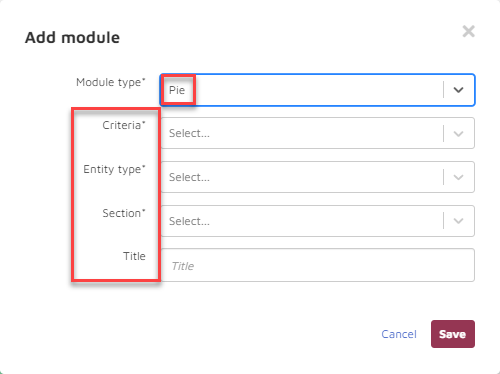
For Module type Pie you need to make decisions regarding: Criteria, Entity type, Section and Title.
Criteria: What criteria are you using to select the data to be used?
Current Search: use the current search.
[Saved search by name]: All saved searches will separately appear by name in this dropdown list. In this example the saved search Accountingis chosen here as the criterion.
Entity Type: For what entity type are you providing statistics? A dropdown list will display both standard and custom entity types (such as Topic, Communicator, Group, Law Firm, etc.).
Section: By choosing Investigation-Accounting Issues you will deploy this module into the row designated by that section header.
Title: Enter a title for the module.
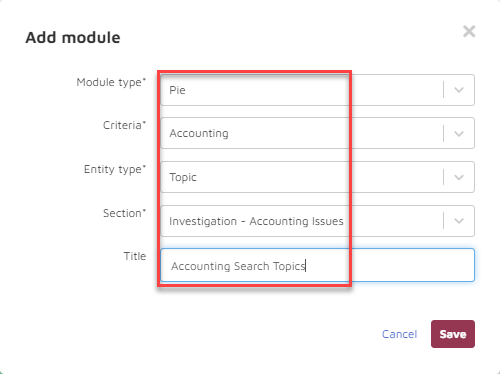
Here is the Add Module window for a Pie graph with responses:
Choose Save and the Investigation – Accounting Issues section now looks like this:
COSMIC
The next module choice is COSMIC. COSMIC is a predictive coding platform explained further below in Section 9 COSMIC (Cognitive Machine Coding).
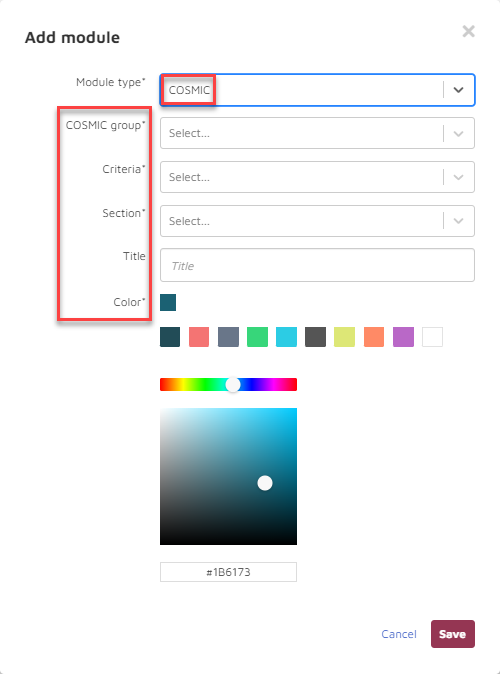
For Module type COSMIC you need to make decisions regarding: COSMIC group, Criteria, Section, Title and Color.
COSMIC group: Choose from the list of previously created COSMIC groups such as Financing Strategy shown below:
Criteria: What criteria are you using to select the data to be used?
Current Search: use the current search.
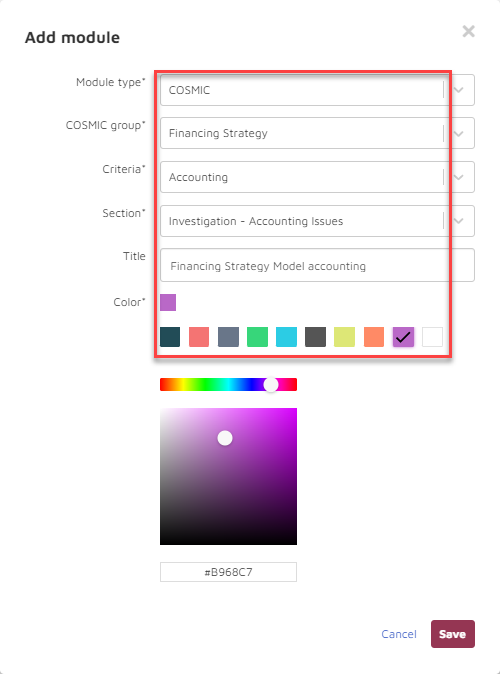
[Saved search by name]: All saved searches will separately appear by name in this dropdown list. In this example the saved search Accountingis chosen again.
Section: As with the Metric, Bar and Pie charts, the section chosen is Investigation-Accounting Issues determining where this module will be deployed.
Title: Enter a title for the module.
Color: As with the Metric, Bar and Pie charts, you will choose the color of the chart.
Here is the Add module window for a COSMIC report with responses:
Choose Save.
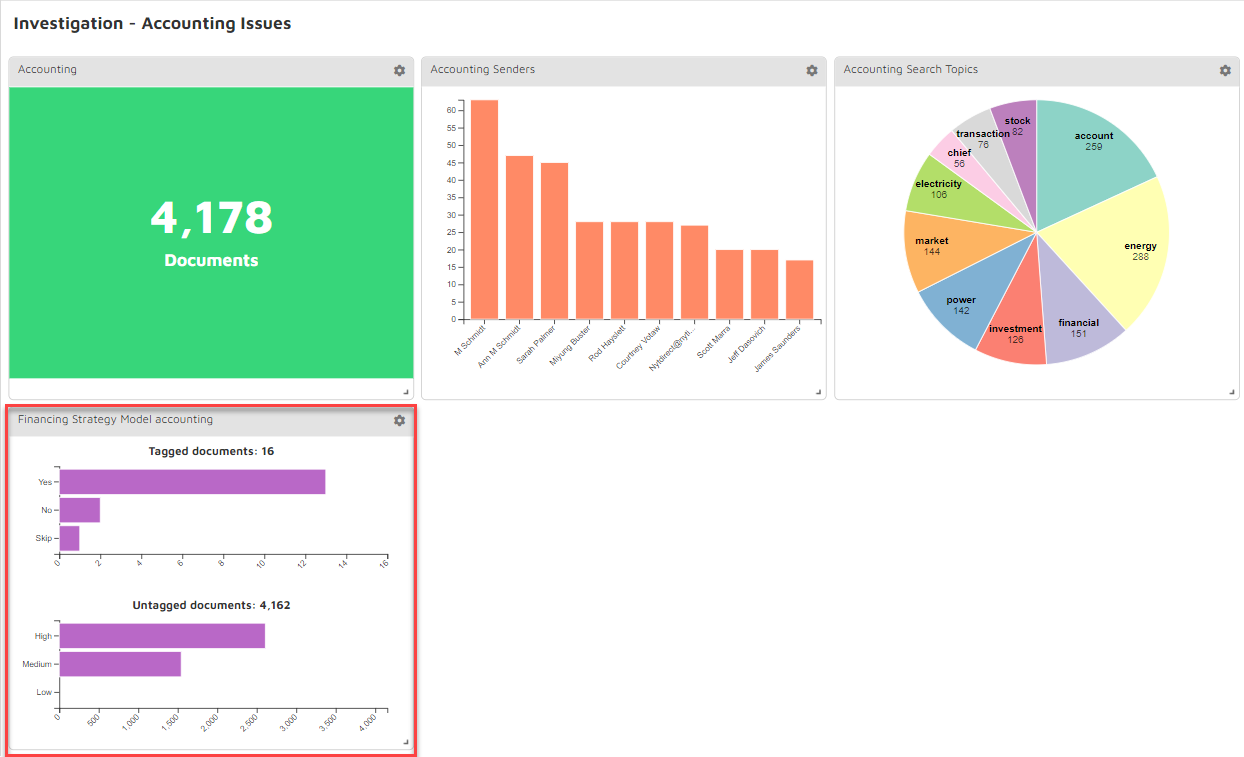
The result is a combination graph that shows (1) how documents have been tagged with respect to the designated COSMIC group field (in this example, whether they are tagged under Financial Strategy or not), and (2) of the untagged documents, what is the likelihood they will be tagged affirmatively upon review.
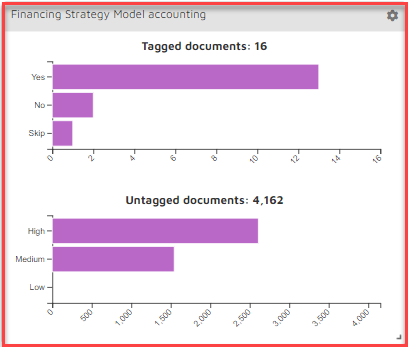
Which appears in the Investigation – Accounting Issues section:
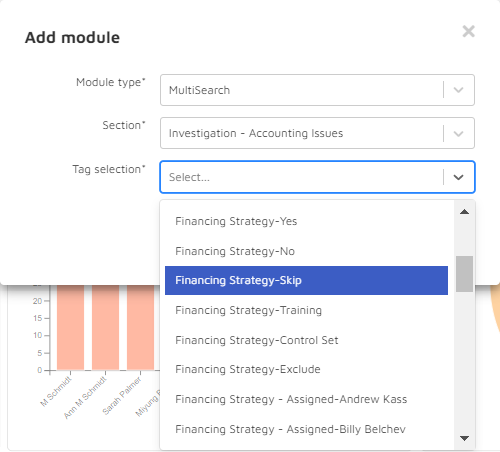
MultiSearch
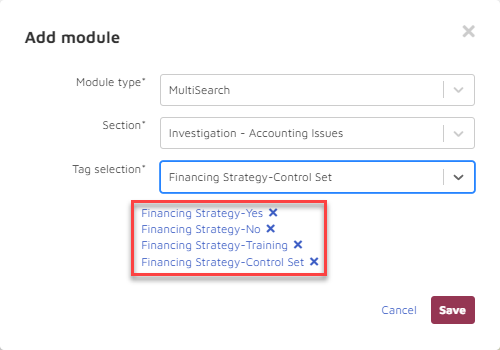
Choosing the MultiSearch module as the module type brings fewer setting choices to the Add module window, but multiple selections may be made for Tag selection after specifying the Section in which the insight module should appear.
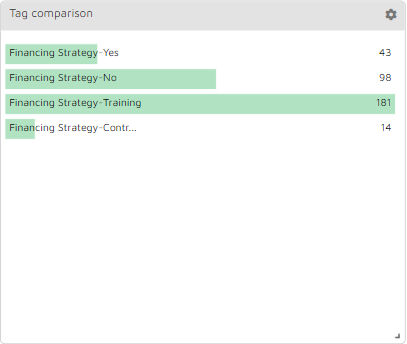
Once you have selected the tag models and choices to display, click Save.
The result charts the choices made for the selected model or models. As with all other Insight graphics, the result may be added to the search with a click.
Interactivity
The graphic modules are interactive so you can choose a graphic component and filter your searches accordingly.
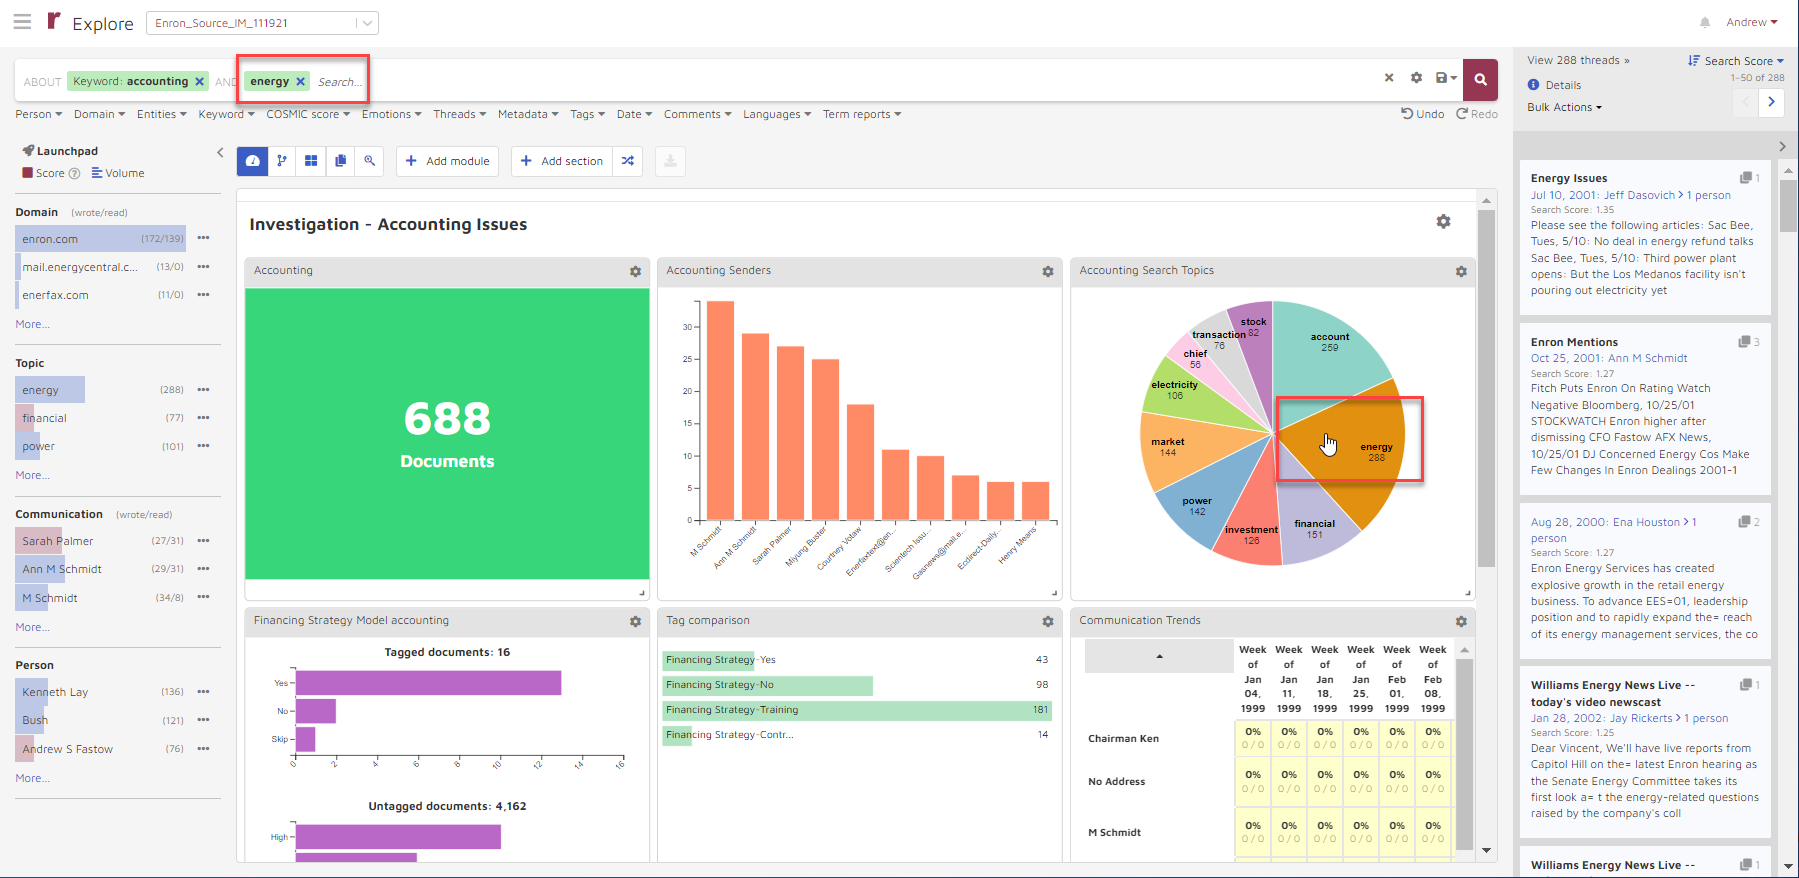
Here’s a closer look.
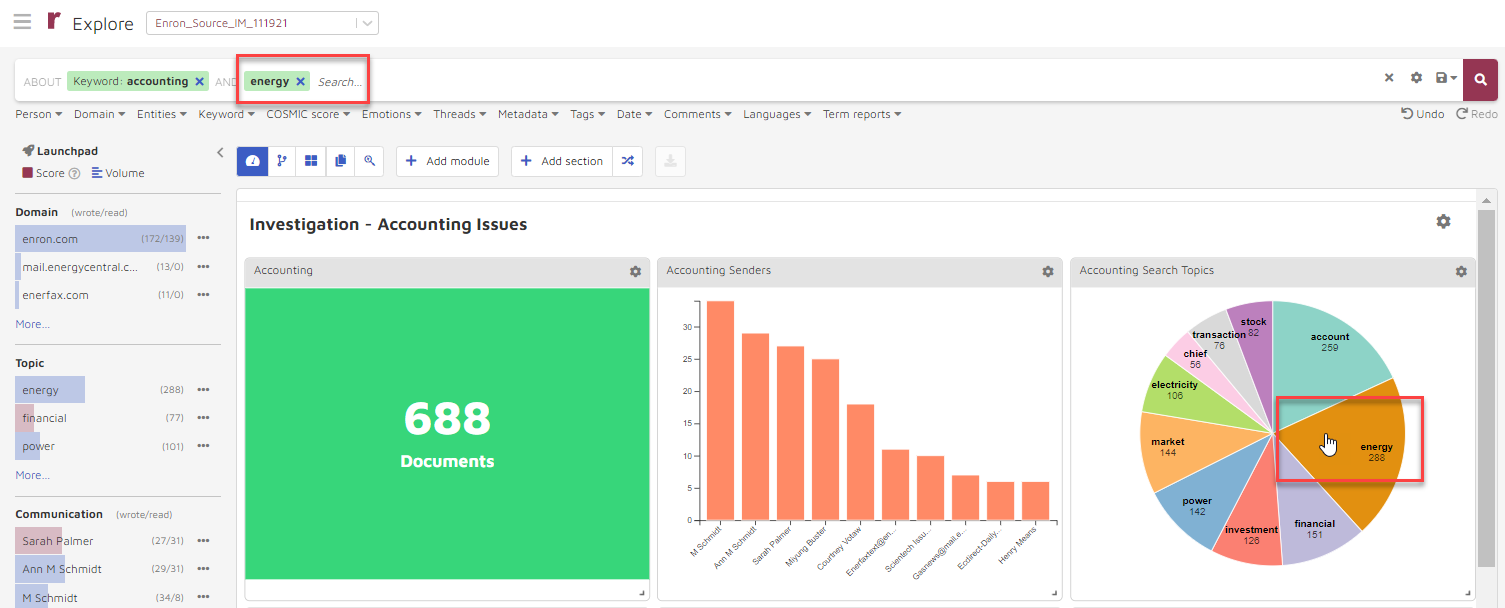
When you click on the Energy section of the Pie chart, the search results change to reflect the addition of the Price filter to the search. “Energy” appears highlighted in green in the search window along with all the pre-existing search criteria.
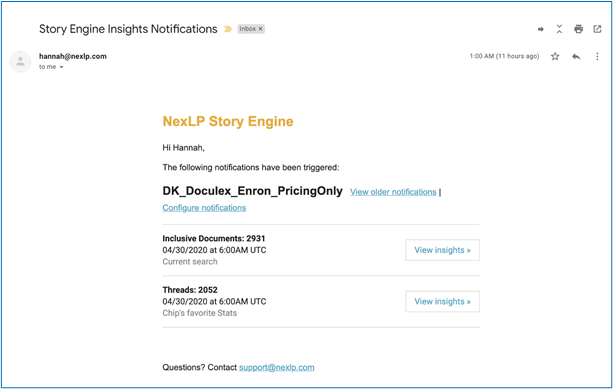
Notification
Your admin may configure notification keying off additions to documents meeting defined criteria. The following is an example of such a notification:
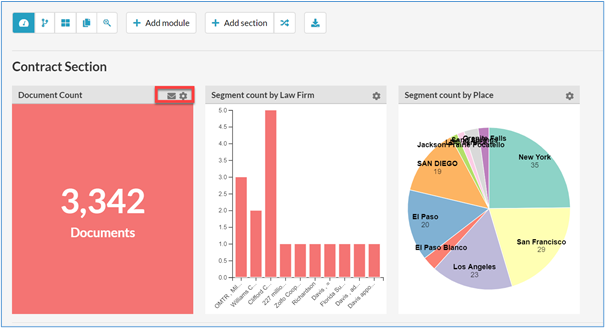
For details, see Admin Guide Section 1 - Storybook Settings > J. Insights notifications. Once notification is set up, this is indicated by an envelope icon appearing in the relevant metric module:
Your admin may have granted you permission to add recipients of notification. If so, to add a recipient of notification, choose the gear icon...
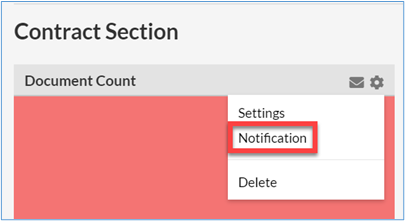
And then choose Notification.
The following window will appear.
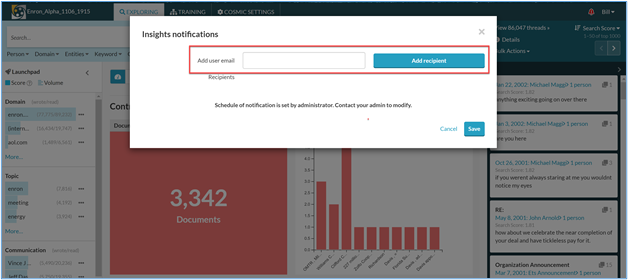
Add the new recipient’s email and choose Add Recipient. Only current Users of this storybook will be accepted.